I know that advertising a personal project is generally bad form on a message board, but hopefully I've contributed enough here to earn an exception. I just accomplished something I'm proud of and wanted to share. And perhaps some here will find it helpful.
With all of my extra time, I've spent a lot of time lately playing with spreadsheets as a portfolio visualization tool. It started simply enough as a way to study the Permanent Portfolio when other portfolio websites did not have the right data, but eventually grew into a more comprehensive tool that could model a wide variety of Lazy Portfolios on demand. As I shared results among my investment comrades, I got some nice feedback and developed a few somewhat unique charts that look at investment returns in different ways. Eventually I realized it would be fun to share. So I built a website.
Check it out. Or not! It's just a pet project and I'm not trying to turn it into a money making venture or anything, so I promise not to shill. But feel free to give it a spin.
Now I can finally check retirement accomplishment #1 off the list.
Last edited by Tyler9000 on Fri Jul 17, 2015 2:26 pm, edited 1 time in total.
I like it - Easy to understand visual presentation of the behavior of the main portfolio types - I haven't seen it presented this elegantly anywhere else.
@Dragline -- Thanks for the portfolio tips. I'll put them in the queue.
@Jack Jones -- Good call. The theme I'm using automatically creates links as the default, but I think I fixed it for that one.
@almostthere -- Just when I feel like I can stop thinking about it for a while, here you go pointing me towards a new tool to learn. Working with Excel and Wordpress is simple enough, but learning a new language would definitely push my boundaries. I'll look into it.
And now more lazy portfolios are up it appears! Great work, I really like the perspective behind it. There is so much more than long-term CAGR to an investment. Also interesting how very different asset allocations all average a 5-6 % real return in the long run.
Thanks oldbeyond. I plan to keep populating new lazy portfolios over time, so you might want to check back periodically. If anyone has a suggestion or special request, feel free to ask. And don't forget to try the calculators for yourself!
Hi, very nicely done! Just for my understanding, the CAGR is the result *without* dividend re-invested, right? Otherwise for US stockmarket, it would result in 7-8% over a long period, if I remember right
The numbers do include reinvested dividends. They also account for inflation every individual year.
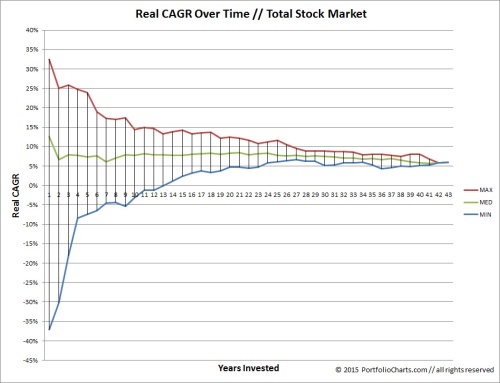
The point of the Funnel chart is to show how looking at a single CAGR number for the "long term" can sometimes be deceptive depending on the period you look at.
The median real return for stocks over any 30 year period since 1972 is 7%. It has been as high as 9% and as low as 5%. But the longer the period you look at, the lower it gets. In the 43 years since 1972 the return is 6%. The larger point is that one single number rarely tells the whole story.
Tyler9000 wrote:
The point of the Funnel chart is to show how looking at a single CAGR number for the "long term" can sometimes be deceptive depending on the period you look at.
This also illustrates that the long-term return is independent of the initial strategy and closer to economic growth rate + leverage.---A point I made in the ERE book if I might add
Another observation is that the "holy wars" are often influenced by anecdotal/autobiographical/fashionable observations of 5-30 year periods. This probably explains 90%+ of all opinionated commentary of the supposed "best" strategy.
jacob wrote:
This also illustrates that the long-term return is independent of the initial strategy and closer to economic growth rate + leverage.---A point I made in the ERE book if I might add
I'm not convinced it's totally independent, but I agree that in the investment world a lot of energy is spent constantly reshuffling the deck chairs for minimum wind resistance rather than watching the sail.
jacob wrote:
Another observation is that the "holy wars" are often influenced by anecdotal/autobiographical/fashionable observations of 5-30 year periods.
Thanks! The review was completely unsolicited and blew me away. I talked to Josh Brown briefly, and he was extremely friendly and insightful. I can't say enough good things about the whole experience.
Thanks, JP. It's always good to have another set of eyes on things. Anything I can do to make things simpler and easier to understand without watering things down is a great idea. I believe there's far too little of that kind of thing in finance.
I sorta like "commentary" as well. It carries more meaning. "Blog" is a really weird word when you think about it.