
There's more to know about markets than any one person's experience, be it the guy you know, any other guru, or anyone on this forum. There are many ways to skin the cat, many cats to be skinned in the market, actors play different games, etc.
Hussman shows a risk of 50-66% [US stock]market losses
Re: Hussman shows a risk of 50-66% [US stock]market losses
Re: Hussman shows a risk of 50-66% [US stock]market losses
I agree 100% with your point here. There will be multiple ways to beat the market over the short term. Heaps of different methods. There won't be one way. Every person will have their own style and there will also be mechanical trading systems.
My main point is that no one or machine consistently does this. It's like predicting the future accurately all the time.
I understand the math idea but there are massive holes in that theory. Long Term Capital Management were the poster children for this approach:- https://www.investopedia.com/terms/l/lo ... apital.asp. I also know from experience that professional traders definitely aren't all like that.
Re: Hussman shows a risk of 50-66% [US stock]market losses
Yeah, I was referring to the motherland. Not sure how accurate the below is (source: business insider) but in the city I'm from you need 2.5-3 net monthly salaries for 1 square meter of a newbuilt flat, so looks quite believable to me. Also looks like affordability deteriorated quite a lot since 2021.

Re: Hussman shows a risk of 50-66% [US stock]market losses
Ah, so you're Polish too? I though it's just mostly me and Stahlmann
Re: your chart, I have no idea how they computed that. Average polish net salary ("in medium and large enterprises, i.e. the only available data) is 4260 PLN (data from Oct 2021), while average price of sq.m. of a flat in Poland is 4944 PLN (data from Q1 2021). So, the ratio is completely different from the the business insider chart you've pasted.
Anecdotally, a crampy 1-bedroom flat in central-ish London (in Zone 2, so not a central by any means) costs 500k EUR. Scandinavian capitals can have similar prices. In Sweden, the _average_ length of a mortgage is 120 years... I think we're still not there yet.
Re: Hussman shows a risk of 50-66% [US stock]market losses
Yeah. Stahlman hasn't been very active lately but there are at least 2 more Polish forumites.
Reading further, they say they used data from Numbeo, so possibly too small of a sample and underrepresenting smaller towns. 5k PLN seems like a fair price in smaller towns but big cities are closer to double that. And then there are issues with how the average wage is calculated (only including firms with 10+ employees, ie. conveniently excluding small businesses which are more likely to pay minimum wage). Either way, the truth as usual is probably somewhere in between.
London prices are insane, for the price of a 2-bed flat there you can buy a 4-5 bed detached house in Scotland. 120-year mortgages sound like slavery passed down the generations.
Back to OP:
There's a lot of talk about froth in the US market, but if you look closer, many mini-bubbles have actually already burst this year: SPACs, very high PE tech stock, no earnings 'story' stocks, meme stocks, etc. got decimated and are in some cases 50-80% down YTD. The averages are pulled up by like 5 stocks with various corrections happening beneath the surface. If anything, this looks like another good argument for index funds and the market might actually be 'healthier' than in Feb despite it being massively up.
Re: Hussman shows a risk of 50-66% [US stock]market losses
When equities are priced in terms of income relative to bonds, equities are still multiples lower than any point in history. There is still a problem of too much capital chasing too few income producing companies (see stock buybacks) and will buoy the market going forward until this condition changes. Higher interest rates or less capital being produced will be the most obvious conditions that could change this dynamic. Pain trade for equities is higher and usually the way these things develop without major disruption (war, natural disaster, black swans that nobody can predict).
-
white belt
- Posts: 1457
- Joined: Sat May 21, 2011 12:15 am
Re: Hussman shows a risk of 50-66% [US stock]market losses
Maybe Hussman's permabear views are finally coming to fruition?
If you accept the premise that nearly all of the SP500 gains since the COVID crash have been due to excess liquidity sloshing around in the system, rather than any sort of fundamental underlying causes, then it would follow that sucking away the liquidity would result in prices reverting to pre-COVID levels. Inflation adjusted, that looks like around the 3500-3600* level for the SP500 (a ~25% correction from the December '21 peak). Of course, nothing says conditions are the same and would revert to that level, although I have heard technical analysts make the argument for that same level if we start to trend downward again.
The counter is that rising interest rates could very well break something else before that large of a market correction. Another counter (which I have no faith in), is that the Fed will bail out asset markets like it has in the past. I don't see that happening while employment and inflation are so high.
I will be interested to see if a major market correction (e.g. bonds and stock indexes losing value in lockstep) affects the mainstream FIRE community's faith in indexing above all else. I count two recent threads on here that were talking about how much cash one should hold (coincidence?). I haven't looked but I imagine there is much more sweating on the MMM and Boglehead forums. When will we start seeing the go back to work/one more year/work part-time threads?
* = I've heard other arguments that the expiration of the Fed put means markets should be valued even lower, perhaps 3000 or below. Stagflation from elevated commodity prices would be even more painful for equities if you believe the thesis that inflation is here to stay.
-
2Birds1Stone
- Posts: 1610
- Joined: Thu Nov 19, 2015 11:20 am
- Location: Earth
Re: Hussman shows a risk of 50-66% [US stock]market losses
With this thread being 3.5 years old, the phrase "even a broken clock is correct twice a day" comes to mind.
The meltup since Covid pandemic crippled global economy has certainly seemed irrational and largely speculative with such a low interest rate environment and money printers going brrrrrrr all around the globe. It will be interesting to see how things shake out over the next 1-2 years.
The meltup since Covid pandemic crippled global economy has certainly seemed irrational and largely speculative with such a low interest rate environment and money printers going brrrrrrr all around the globe. It will be interesting to see how things shake out over the next 1-2 years.
-
Mister Imperceptible

- Posts: 1669
- Joined: Fri Nov 10, 2017 4:18 pm
Re: Hussman shows a risk of 50-66% [US stock]market losses
Another old thread was the “Permanently low interest rates?” thread, which may not be resuscitated as it looks like interest rates will not be permanently low, in which @bsog posted the following:
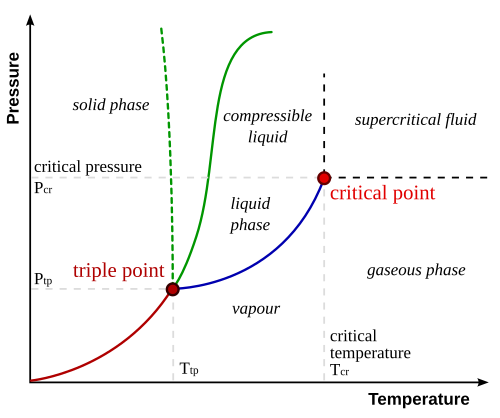
I never understood why anyone with a low time preference and a long horizon could ever build a strategy that does not consider the “down” and “zero” phases as only temporary phases en route to the “up” phase. Especially as it seems that the up phase will result in the most significant asset and currency re-ratings.black_son_of_gray wrote: ↑Tue Aug 20, 2019 2:50 pmIn chemistry, if we want to know what state a substance will be in, we can plot out a phase diagram—a graph of temperature and pressure that shows the boundaries of the different states. An example diagram for water:
(Image link if you can't see it)
So, for the intuitive example of water, low temperatures usually give ice, high temperatures usually give water vapor, and in-between, moderate temperatures and pressures allow liquid water. Science 101, sure, but I bring it up for the (hopefully) useful concept of the triple point. The triple point is the intersection point along the phase boundaries where three different states can coexist and easily tip into any of the distinct, bordering states. And I can't help but think that we are close to the economic equivalent of the triple point. Here's my thinking...
A thought experiment
[TL;DR: all of your ideas are correct at the same time.]
If we were to plot a phase diagram for the economy, our two axes might be interest rates and debt load and the states of the economy might be inflation, deflation, and stagnation. In the US, interest rates broadly have been going down since the 1980's, and we find ourselves pretty close to zero, but just above it. Around the world, some places are below zero, some are at zero. This is the economic triple point.
Barring some black swan reorganization of the financial system (global debt jubilee?), the interest rates can go three ways from this economic triple point: up, down, or zero.
Looking forward, there are 1) very reasonable/logical arguments 2) championed by very smart, successful investors, and 3) historical precedents/examples for each of these states. That is why I like the triple point metaphor: because it provides a context for understanding how all of these arguments could be correct, just as multiple states of a substance are reasonably possible at its chemical triple point. Another useful observation: because we are near the triple point, a move into any state could rapidly change course and enter another state. This is because the boundaries are still very close to each other in the area surrounding a triple point. In water terms, that is just saying that ice that is close to the freezing point can pretty quickly start to melt vs. ice that is -100C. Economy-wise, this means a rapid switch of states is maybe even likely: for example, my best guess for the near-term trajectory is that rates will plummet globally (deflation) until that course reaches the breaking point (no sure when, but soon-ish?), and will then be followed by a rapid shift toward inflation in a desperate attempt to relieve debt burdens. Straddling the zero line might be possible for an extended period, but I doubt it can be maintained permanently—if for no other reason, simply because the area on the phase diagram that describes stagnation is pretty narrow (spitballing, we might define it as between 0ish and the S&P dividend rate). So even being deep in stagnation territory is still relatively close to either inflation or deflation, and it is too taxing for central banks and the lags in their policy actions to be able balance in this narrow space indefinitely (their track records for soft landings is almost nonexistent/ can they even agree on what r* is?).
- Up: Debt loads are so massive that slight increases in interest rates tip the system into inflation, because the only policy way to relieve the crushing burden of all that debt is to inflate it away. The problem with intentionally trying to inflate away the debt, outside of the fact that it violates one of the two Fed mandates (employment, stable prices), is that it can easily get out of control and shoot to the moon. Gold bugs might do very well in this state of the system. Holding bonds would be a disaster.
- Down: In a race to the bottom to devalue currency, interest rates can keep on chugging deep into the negative. The system here is in deflation because spending $130 to get back $100 in the future ultimately reduces money supply (right??). Long term this is unsustainable, because it literally turns the banking business model upside down (borrow short/lend long doesn't work). See Japan and European bank stocks. Without a workable banking sector, modern economies cannot function—the patient can only be bled so long. But in the meantime, falling rates are good for bonds, even if rates are negative because the prices still go up, and bad for stocks because appreciating inventory incentivizes slow turnover/sales/waiting-instead-of-moving-forward.
- Zero: The system near zero is in a state of stagnation. Real growth in the economy is very slow or non-existent for a number of reasons. 1. Unproductive, zombie companies can keep limping along financed by cheap debt. 2) Any company that can borrow for less than the rate of its dividend will just buy back its own stock instead of make capital investment (it's a no-brainer balance sheet move) 3) etc. The main theme here is that money continues to be so inefficiently allocated that the best the economy can do is tread water. Stocks may be the cleanest dirty shirt here, even "growth" stocks with negative cash flows. Cash and bonds and everything else stink. TINA. But that party can't last forever right? Zombies do eventually die, right?
Ok, I'll leave it at that. My intention wasn't to be comprehensive—I'm just throwing this idea out there for discussion. Please tear it apart, add to it, ignore it as you see fit.
Re: Hussman shows a risk of 50-66% [US stock]market losses
Hussman, Schiff other perma bears fall into the trap of trying to predict the market and not simply just recognizing when the market changes (to the detriment to their clients). Unfortunately, three of the conditions mentioned in December post have recently come true: Higher interest rates (March/April were ridiculous), lower capital produced by corporations (negative 1st quarter GDP) and semi hot and growing war (worse yet in the #1 trading partner with the US and largest economy in the world (Europe)). These conditions force one to at least recognize the conditions which create a bull market are no longer true and a bear market is now the likely regime.
MMM = My experience with that "forum" was more of an echo chamber where the forum was just a cliff notes of MMM past posts. There is a forum called something like "Top is in" which I didn't know was a joke forum where people post memes of those calling the market has topped. I posted I thought the top was in in mid-January, was attacked and then banned. Don't know if the MMM posters are ignorant, fake or both in that any post that does not repeat what Pete wrote 10 years ago is met with extreme attacks. Asking MMM posters about market conditions is like asking the frog about the boiling water "Feels the same as it did a few minutes ago". The average MMM member appears to have an IQ not significantly different from a frog and would prefer to boil than utilize brain power to formulate an alternative idea to the "60/40-4% till I die" chant.
My humble prediction is that all markets will come close to March 2020 lows: S&P 500 = 2,100, Nasdaq = 6,000, Bitcoin = $3,000, NFT = $0. Markets almost always swing higher and lower than anyone could have predicted prior to the runup/rundown.
Phase is the chemistry term for a change in states and called a Markov regime switching model in stats and finance. IMHO, the market switched from Bull to Bear in late 2021, but I did not recognize this until mid-January 2022. I've missed every switch my entire investing career by around 10%, but usually enjoy the middle 80% of bull markets and avoid the middle 80% of bear markets.
-
Michael_00005
- Posts: 130
- Joined: Thu May 04, 2017 12:26 pm
- Location: East coast USA
Re: Hussman shows a risk of 50-66% [US stock]market losses
I posted an article not so long ago (Avoiding a Bear market); the video/lecture is long but VERY good! The post did not get much love; sorta wonder if anyone even watched the long video... none of the comments in the post are relevant to the linked video.
viewtopic.php?t=12344
I moved to all cash after researching the material and figuring things out earlier this year - so glad I did! Recently I've been making decent money using the links in the post and signing up my email on Dr. Wish's site, but most of my funds are in cash. I'm going to wait for the upward trend before moving back in with more money, one of the popular tools was created by William J. O'Neil to figure that out, and it revolves around a "follow-through day", and other tools.
Sorta expecting the CPI report coming out on 5/11/22, to be a big factor in where the market heads short term and will likely go all cash before it's out.
My strategy basically revolves around investing with the current market trend (which is obviously down now) and following the market leaders which you can easily find with a little effort.
So for example I'm long very short term a few right now, and will likely be out for any earnings: ZIM, AMR, HRT, OVV. Using a Stop Loss is key to the strategy.
-
prudentelo
- Posts: 173
- Joined: Sat Jan 22, 2022 8:55 am
Re: Hussman shows a risk of 50-66% [US stock]market losses
Unclear "crash" will be nominal. Almost all people strategize against "crash" look at nominal value.
If you invest in cash for 3 years 10% inflation you lose 27% of wealth i.e. "crash." But unlike stocks, can't come back.
Will the stock market go down 27% nominal at same time nominal profits increase because of inflation? What PE does it imply? Is it realistic while bonds pay -10%?
2008, COVID Crash great for nominal preppers who move into cash. Prepare for last war.
1966 stagflation was worse (slightly) for FIRE than Great Depression huge nominal crash.
Re: Hussman shows a risk of 50-66% [US stock]market losses
How do you use a stop loss ?Michael_00005 wrote: ↑Fri May 06, 2022 4:03 pmI posted an article not so long ago (Avoiding a Bear market); the video/lecture is long but VERY good! The post did not get much love; sorta wonder if anyone even watched the long video... none of the comments in the post are relevant to the linked video.
viewtopic.php?t=12344
I moved to all cash after researching the material and figuring things out earlier this year - so glad I did! Recently I've been making decent money using the links in the post and signing up my email on Dr. Wish's site, but most of my funds are in cash. I'm going to wait for the upward trend before moving back in with more money, one of the popular tools was created by William J. O'Neil to figure that out, and it revolves around a "follow-through day", and other tools.
Sorta expecting the CPI report coming out on 5/11/22, to be a big factor in where the market heads short term and will likely go all cash before it's out.
My strategy basically revolves around investing with the current market trend (which is obviously down now) and following the market leaders which you can easily find with a little effort.
So for example I'm long very short term a few right now, and will likely be out for any earnings: ZIM, AMR, HRT, OVV. Using a Stop Loss is key to the strategy.
How do you know the market is trending up ?
Over the long term how does cash perform ?
Over the long term how do stock indexes perform ?
Do you believe that you can pick stocks well ? If so how experienced are you at this ? If you are good do you realize that companies/people will pay you to manage their hedge funds ?
Do you understand modern portfolio theory ?
How large is your account ?
How long have you been trading for ?
Re: Hussman shows a risk of 50-66% [US stock]market losses
My humble prediction is that we will not go as low as 2020. But let's see