lillo9546 wrote: ↑Tue Jan 17, 2023 3:08 pm
Would you like to help me understand?
The only path on this forum is to do a lot of reading. Here's how you could take a chart you like and use the tools available to learn about it:
Click through the links where the charts came from (that can include the up arrow in the yellow box) and read the threads. When you hit terms you don't know, try entering them in the search bar above and then reading those threads.
Also, worth trying as a resource to search through is the wiki:
https://wiki.earlyretirementextreme.com/wiki/Main_Page
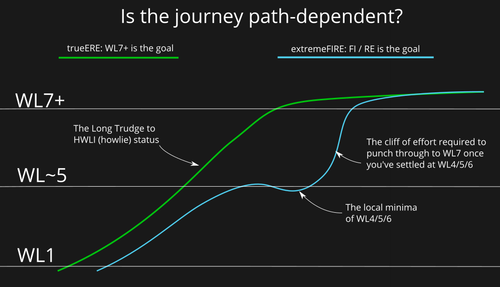
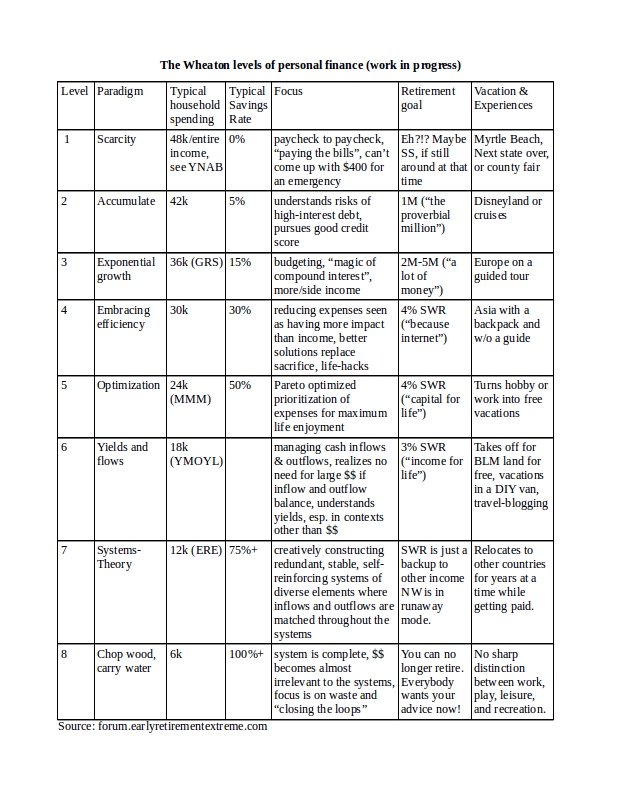
I find the forum search more likely to yield a result, but when the wiki page has a result, it is usually comprehensive. One problem with the forum search also is that it doesn't work for terms less than 4 characters, so I'm going to get you started with "WL" means "Wheaton Level."
And here is the wiki entry:
https://wiki.earlyretirementextreme.com ... ton_Levels
And a very useful chart:
https://earlyretirementextreme.com/myfo ... Levels.jpg
Well... you have a lot of reading to do. I would recommend first trying to figure out what WL you are and then starting a journal thread where you build up your ideas and report on your lifestyle experiments. The journal threads to be the place where the feedback is better and people tolerate things being a little looser.


